Physical Address

304 North Cardinal St.
Dorchester Center, MA 02124

Candlesticks- Let’s delve into the basics!

Reading Time: 3 minutes

The candlestick consists of a ‘Real Body’. It is the rectangular section of the candlestick that depicts the range between the opening and closing price during the session. If the closing price is greater than the opening price, then the real body is represented in Green color. If the opening price is greater than the closing price, then the real body is represented in Red color. The candlestick also consists of the ‘Upper shadow’ and ‘Lower shadow’. The highest point of the upper shadow is the maximum price the stock touched during the session. The lowest point of the lower shadow is the minimum price the stock touched during the session. When the real body color is Green, it is known as a bullish candle, whereas, when the real body color is Red, it is known as a bearish candle.

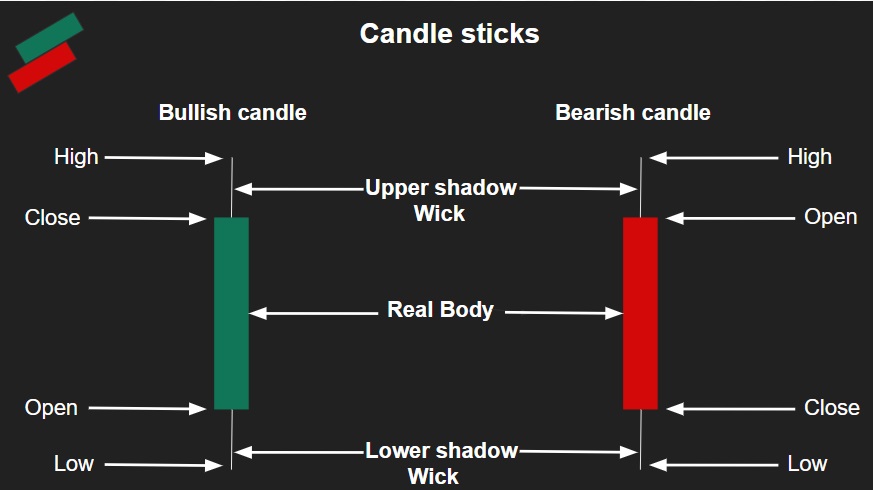
The difference between the highest and the lowest price point on the candle is the total range in which the stock traded during the session.

As in the case of real candle, the candlestick also consists of the real body and the wick (shadow).

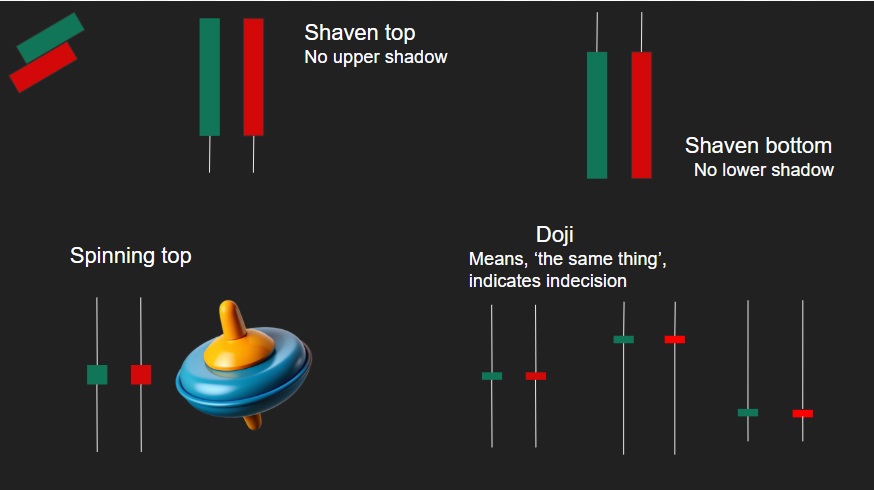
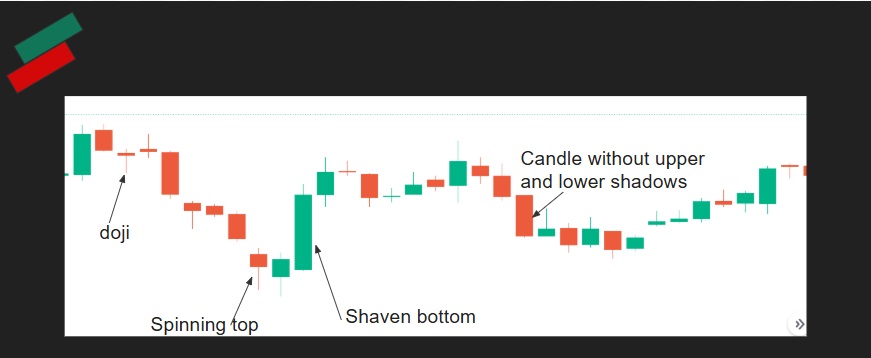
These are few examples of candlestick types.

  • A candlestick without the upper shadow is known as ‘Shaven Top’. For a bullish formation, this means, the highest traded price is equal to the closing price of the session. For a bearish formation, the highest traded price is equal to the opening price of the session.
  • A candlestick without the lower shadow is known as ‘Shaven Bottom’. For a bullish formation, this means, the lowest traded price is same as the opening price of the session. For a bearish formation, the lowest traded price is equal to the closing price of the session.
  • Large real body indicates strength of the respective formation i.e. a large green body indicates a strong up trend whereas a large red body indicates a strong downward trend.
  • A candlestick with a small real body is known as ‘Spinning top’. This indicates loss in energy of the prior momentum. There are few variations of the spinning top candlestick formations that will be discussed in a separate blog post.
  • When the size of the real body is next to nothing i.e. the opening and closing price of the stock during the session has almost been at the same level, then such candlestick formation is called ‘Doji’. The doji indicates indecision and alludes to a possible reversal in previous trend.

Leave a Reply

Your email address will not be published. Required fields are marked *